More 2D parametric equations with Processing
This is not a math tutorial. See Why am I writing about math?
Related to notes/ Drawing a point from the parametric representation of a line.
Circle #
The unit circle can be described by the Cartesian equation
The equation can be parameterized as
Scaled up from the unit circle
Processing implementation:
float radius = 100;

size(400, 400);
background(235);
strokeWeight(2);

translate(width/2, height/2);
scale(1, -1);

for (float t = 0; t <= TWO_PI; t += 0.1) {

  float x = radius * cos(t);
  float y = radius * sin(t);
  point(x, y);
}
Ellipse #
An ellipse in canonical position (?) (notes / Knowing where to stop)
Processing implementation:
float a = 100;
float b = 75;

size(400, 400);
background(235);
strokeWeight(2);

translate(width/2, height/2);
scale(1, -1);

for (float t = 0; t <= TWO_PI; t += 0.1) {

  float x = a * cos(t);
  float y = b * sin(t);
  point(x, y);
}
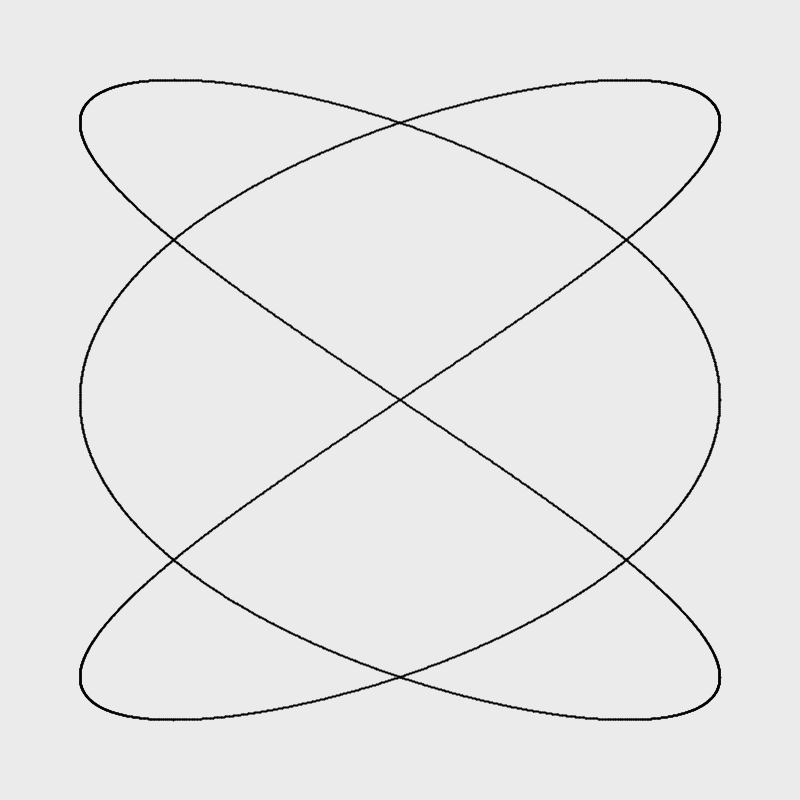
Lissajous curve #
A Lissajous curve is similar to an ellipse, but the x and y sinusoids are not in phase.1
float a = 160;
float b = 160;
float kx = 3;
float ky = 2;

size(400, 400);
background(235);
strokeWeight(1);

translate(width/2, height/2);
scale(1, -1);

for (float t = 0; t <= TWO_PI; t += 0.001) {

  float x = a * cos(kx * t);
  float y = b * sin(ky * t);
  point(x, y);
}
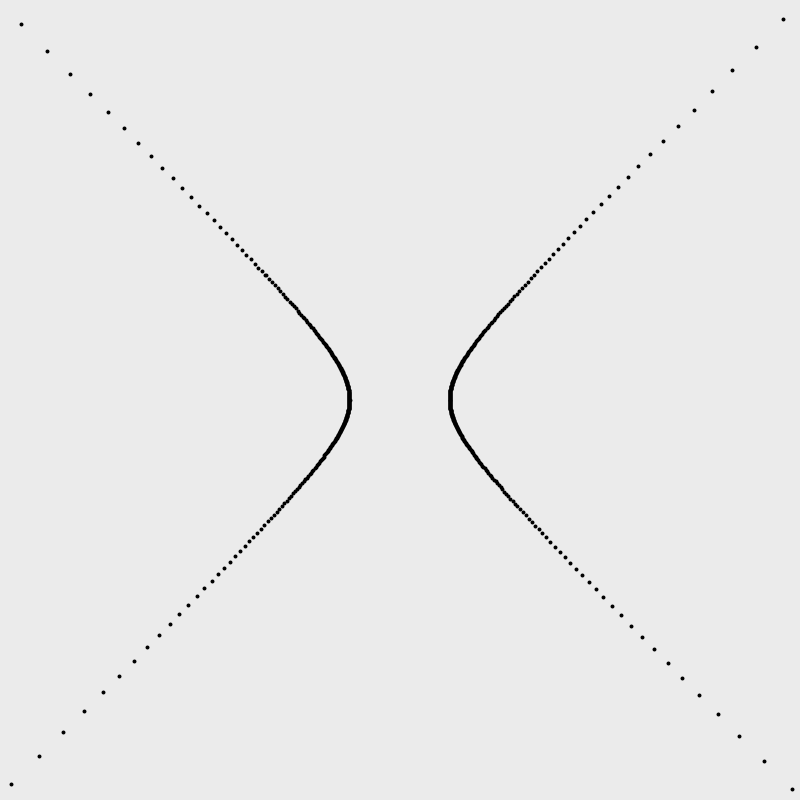
Hyperbola #
An east-west opening hyperbola
Where:
(h, k)are the center coordinates of the hyperbolaais the length of the semi-major axis (see Wikipedia link above)bis the length of the semi-minor axis
Note that sec(t) = 1/(cos(t)).
float h = 0;
float k = 0;
float a = 25;
float b = 25;

size(400, 400);
background(235);
strokeWeight(2);

translate(width/2, height/2);
scale(1, -1);

for (float t = 0; t <= TWO_PI; t += 0.01) {
  float x = a * (1/cos(t)) + h;
  float y = b * tan(t) + k;
  point(x, y);
}
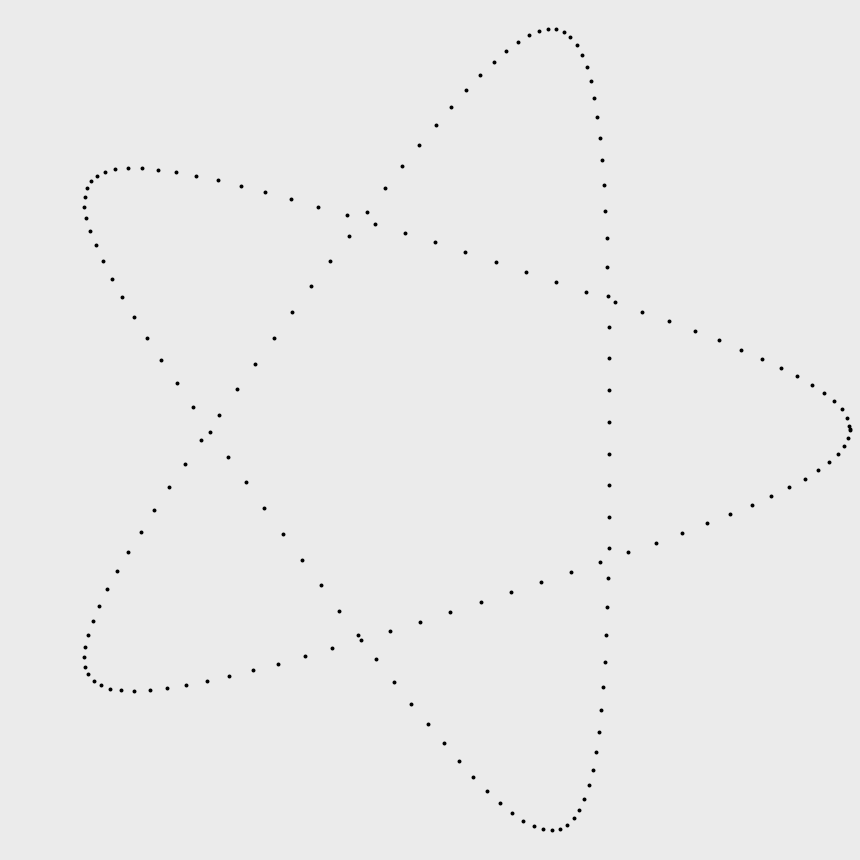
Hypotrochoids #
A hypotrochoid is a curve traced by a point attached to a circle of radius that is rolling around the inside of a fixed circle with the radius . The point on the rolling circle is at distance from the center of the (rolling) circle.2 This is easier explained with a video example
R=5, r=3, d=5:
float r = 90;
float R = 150;
float d = 150;

size(430, 430);
background(235);
strokeWeight(2);

translate(width/2, height/2);
scale(1, -1);

for (float t = 0; t <= TWO_PI * 3; t += 0.1) {
  float x = (R - r) * cos(t) + d * cos(((R - r)/r) * t);
  float y = (R - r) * sin(t) - d * sin(((R - r)/r) * t);
  point(x, y);
}
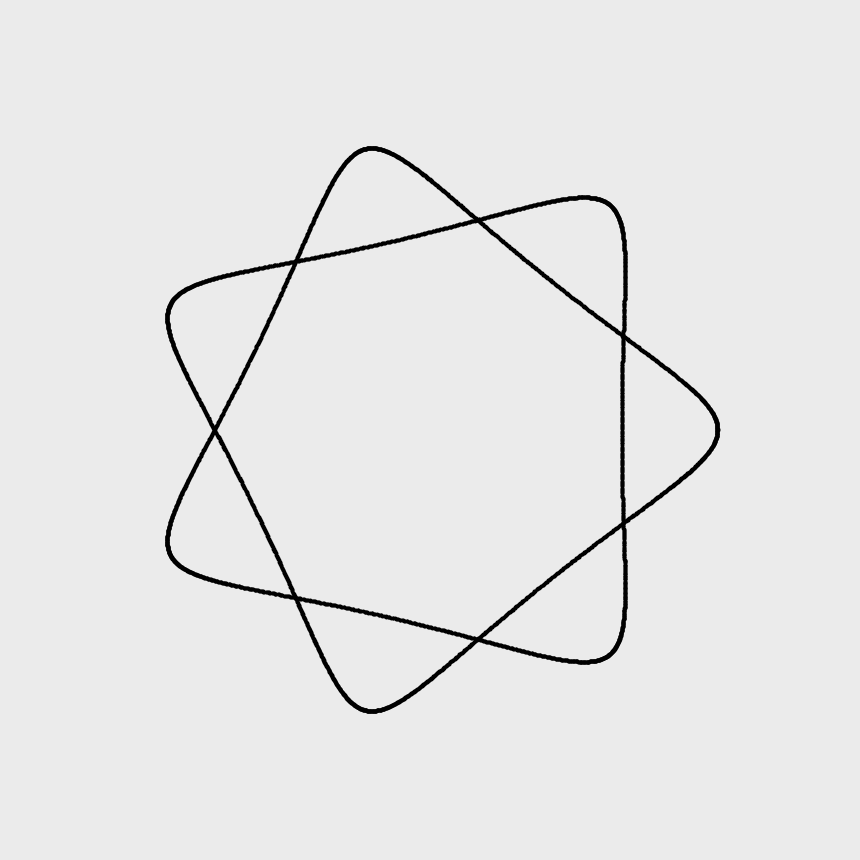
r=14, R=15, d=1:
float r = 14 * 100;
float R = 15 * 100;
float d = 1 * 100;

size(430, 430);
background(235);
strokeWeight(2);

translate(width/2, height/2);
scale(1, -1);

for (float t = 0; t <= TWO_PI * 30; t += 0.05) {
  float x = (R - r) * cos(t) + d * cos(((R - r)/r) * t);
  float y = (R - r) * sin(t) - d * sin(((R - r)/r) * t);
  point(x, y);
}
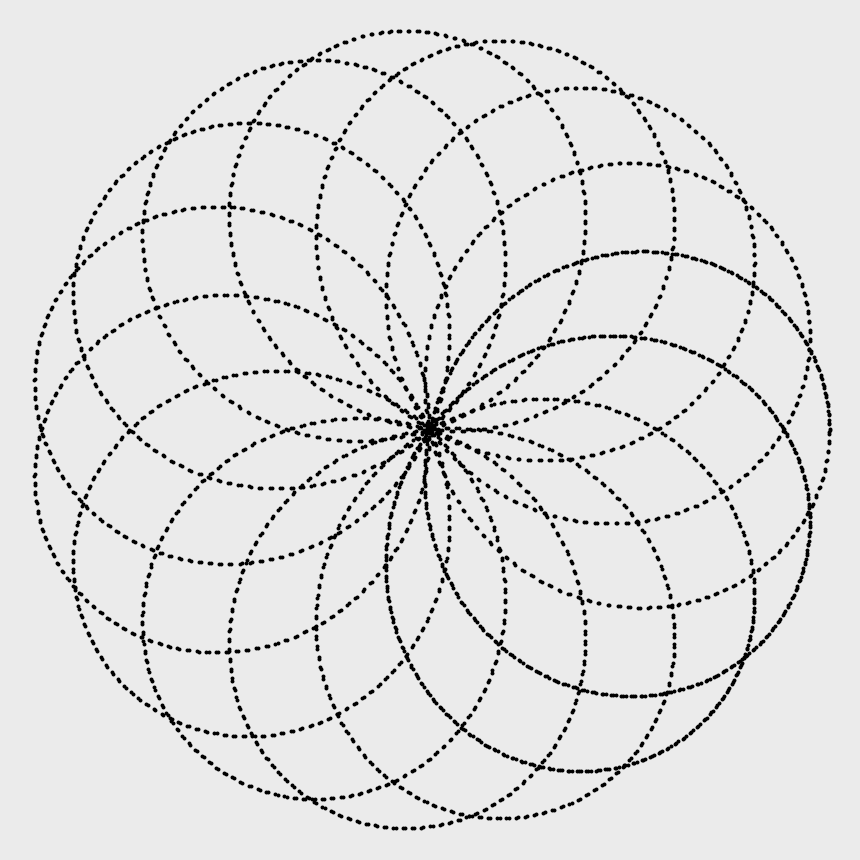
This is addictive…
Hypotrochoid video examples #
r=2, R=4.2, d=6:
r=3, R=6, d=2:
r=7, R=5, d=7:
Video example code #
It uses an
ArrayList
of
PVector
objects to store the points as they are generated. That makes it possible to call background() within the draw loop.
float r = 4 * 16;
float R = 8 * 16;
float d = 11 * 16;
float t = 0;

ArrayList<PVector> points = new ArrayList<PVector>();

void setup() {
  size(500, 500);
  noFill();
  frameRate(30);
}

void draw() {
  translate(width/2, height/2);
  scale(1, -1);

  background(235);
  stroke(112, 26, 56, 12);
  ellipse(0, 0, R * 2, R *2);

  float rcX = (R-r) * cos(t);
  float rcY = (R-r) * sin(t);
  float dX = rcX + d * cos(((R-r)/r) * t);
  float dY = rcY - d * sin(((R-r)/r) * t);


  ellipse(rcX, rcY, r*2, r*2);
  stroke(112, 26, 56, 22);
  line(rcX, rcY, dX, dY);

  stroke(43, 61, 153);
  strokeWeight(2);
  points.add(new PVector(dX, dY));
  for (int i = 0; i < points.size() - 1; i++) {
    PVector p1 = points.get(i);
    PVector p2 = points.get(i+1);
    line(p1.x, p1.y, p2.x, p2.y);
  }

  t += 0.1;

  // saveFrame();
  if (frameCount > 1200) {
    noLoop();
  }
}
References #
Wikipedia contributors. “Parametric equation.” Accessed on: January 20, 2026. https://en.wikipedia.org/wiki/Parametric_equation .
-
Wikipedia contributors, “Parametric equation,” Accessed on: January 20, 2026, https://en.wikipedia.org/wiki/Parametric_equation . ↩︎
-
Wikipedia contributors, “Parametric equation,” Accessed on: January 20, 2026, https://en.wikipedia.org/wiki/Parametric_equation . ↩︎