Creating Mandelbrot fractals with Processing
The Mandelbrot set is a two-dimensional set that is defined in the complex plane as the complex numbers for which the function does not diverge to infinity when iterated starting at …1
I understand that to mean:
- a set is a collection of things
- a two-dimensional set is (tentatively) a collection of things that can be accessed by two indices. E.g. row number,column number.
- the complex plane is two-dimensional, with a horizontal real axis and a vertical imaginary axis
- the Mandelbrot set is the collection of complex numbers that do not head towards infinite values when the function is repeatedly applied to them
- the initial value that’s used when calling the function is
The formula that’s used for determining if a complex number is in the Mandelbrot set #
The function is simpler than its description. Testing it in the Python REPL (IPython):
start with :
In [9]: z = complex(0, 0)

In [10]: z
Out[10]: 0j
start with some value for (this would be a point from the complex plane in a real implementation):
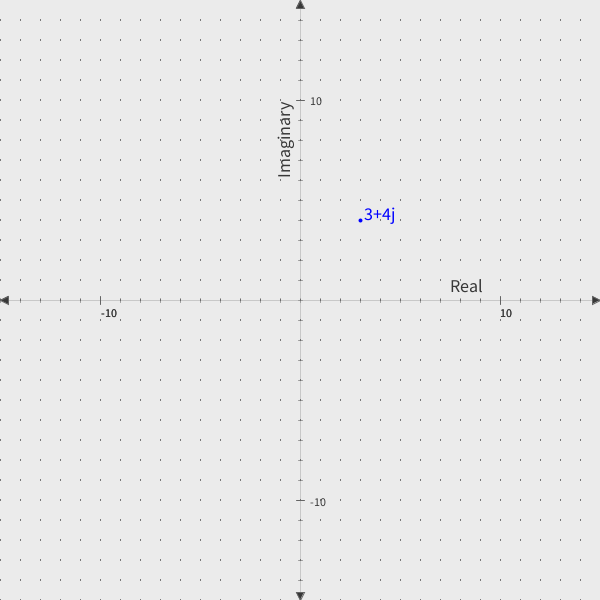
In [11]: c = complex(2, 3)

In [12]: c
Out[12]: (2+3j)
update the value of using the current values of and :
In [13]: z = z * z + c

In [14]: z
Out[14]: (2+3j)
now equals the initial value of :
determine if (the initial value from the complex plane) is indicating it will diverge to infinity:
The test is to check if the magnitude (or absolute value) of exceeds some threshold. My (tentative) understanding is that if the magnitude of is greater than , it will eventually (possibly quickly (?)) approach infinity. (I’ll look into this more later.)
In [15]: abs(z)
Out[15]: 3.605551275463989
Since , (2+3j) is not in the Mandelbrot set.
I’ll find a value of that doesn’t exceed a magnitude of 2 on the first iteration:
In [20]: c = complex(1.3, 0.7)

In [21]: z = complex(0, 0)

In [22]: z = z * z + c

In [23]: abs(z)
Out[23]: 1.47648230602334
Since when starting with doesn’t exceed 2 after the first iteration, it’s possible it’s in the Mandelbrot set. To find out, call the function again:
In [24]: c
Out[24]: (1.3+0.7j)  # the initial value of c (it doesn't get updated)

In [25]: z
Out[25]: (1.3+0.7j)  # the value of z that was set in the first iteration

In [26]: z = z * z + c  # update z

In [27]: abs(z)
Out[27]: 3.5497042130295866  # the magnitude of z exceeds 2.0
So is also not in the Mandelbrot set.
(the real/imaginary intersection of the complex plane) is guaranteed to be in the Mandelbrot set. Zero times zero plus zero will always equal zero:
In [28]: z = complex(0, 0)

In [29]: c = complex(0, 0)

In [30]: z = z * z + c

In [31]: abs(z)
Out[31]: 0.0
Testing some more interesting complex numbers #
is a good case. The (Python) code below assigns the starting value of to as usual, and assigns to . It then tries running the function 50 times, to see if the absolute value of exceeds :
In [42]: z = complex(0, 0)

In [43]: c = complex(-0.5, 0.5)

In [44]: for i in range(50):
    ...:     z = z*z+c
    ...:     print("iteration:", i, "z:", z)
    ...:     if abs(z) > 2.0:
    ...:         print(c, "is not in the Mandelbrot set")
    ...:         break
    ...:
iteration: 0 z: (-0.5+0.5j)
iteration: 1 z: (-0.5+0j)
iteration: 2 z: (-0.25+0.5j)
iteration: 3 z: (-0.6875+0.25j)
# ...
iteration: 45 z: (-0.5500488745365836+0.23115432457577173j)
iteration: 46 z: (-0.250878557391119+0.24570764784566523j)
iteration: 47 z: (-0.49743219765120045+0.3767144395370289j)
iteration: 48 z: (-0.3944749776955948+0.12522021690831092j)
iteration: 49 z: (-0.3600695946946244+0.401207515456113j)
Based on a test of 50 iterations, it can tentatively (in a real sense this time) be said that is in the Mandelbrot set. The values of on each iteration are bouncing around the origin . The values are showing bounded chaotic behavior. EDIT: it seems that most of the numbers that fall withing the Mandelbrot set either resolve to a single number or enter into a non-chaotic period. See notes / Tracing how numbers change during the Mandelbrot iterations
Note that the magnitude of a
complex number is the distance of the number from the origin of the complex plane. In Python I’m
calculating it with abs(z). When a complex number is given as the argument to the Python abs
function, the magnitude of the number is returned:
iteration: 49 z: (-0.3600695946946244+0.401207515456113j)

In [52]: abs(z)
Out[52]: 0.5390895876215921
The magnitude is essentially the hypotenuse of the number on the complex plane:
iteration: 49 z: (-0.3600695946946244+0.401207515456113j)

In [52]: abs(z)
Out[52]: 0.5390895876215921

In [53]: z.imag
Out[53]: 0.401207515456113

In [54]: z.real
Out[54]: -0.3600695946946244

In [55]: np.sqrt(z.real*z.real + z.imag*z.imag)  # the square root of a^2 + b^2 = c^2
Out[55]: np.float64(0.5390895876215921)
Returning the magnitudes from the Python script #
Here’s a similar script that returns the current magnitude of , starting from :
In [78]: z = complex(0, 0)

In [79]: c = complex(-0.12, 0.75)

In [80]: for i in range(50):
    ...:     z = z * z + c
    ...:     print(f"iteration: {i}, abs(z): {abs(z)}")
    ...:     if abs(z) > 2.0:
    ...:         print(f"iteration: {i}; {c} is not in the Mandelbrot set")
    ...:         break
    ...:
    ...:
iteration: 0, abs(z): 0.7595393340703298
iteration: 1, abs(z): 0.8782127361863982
iteration: 2, abs(z): 0.011724955561199504
iteration: 3, abs(z): 0.7595269050363009
iteration: 4, abs(z): 0.8780252871118147
iteration: 5, abs(z): 0.011391498992753827
iteration: 6, abs(z): 0.7595241904450459
# ...
iteration: 44, abs(z): 0.011405972274973704
iteration: 45, abs(z): 0.7595245098608843
iteration: 46, abs(z): 0.8780333368437104
iteration: 47, abs(z): 0.011405972274973704
iteration: 48, abs(z): 0.7595245098608843
iteration: 49, abs(z): 0.8780333368437104
Based on 50 iterations, is in the Mandelbrot set.
A complex number that’s not in the Mandelbrot set #
escapes the bounds of after 15 iterations:
In [81]: z = complex(0, 0)

In [82]: c = complex(-0.8, 0.2)

In [83]: for i in range(50):
    ...:     z = z * z + c
    ...:     print(f"iteration: {i}, abs(z): {abs(z)}")
    ...:     if abs(z) > 2.0:
    ...:         print(f"iteration: {i}; {c} is not in the Mandelbrot set")
    ...:         break
    ...:
iteration: 0, abs(z): 0.8246211251235321
iteration: 1, abs(z): 0.233238075793812
iteration: 2, abs(z): 0.8131416604749754
iteration: 3, abs(z): 0.32005852224930614
iteration: 4, abs(z): 0.820739300530877
iteration: 5, abs(z): 0.3944899747490221
iteration: 6, abs(z): 0.8499974263391781
iteration: 7, abs(z): 0.47633146090875766
iteration: 8, abs(z): 0.9179848147566967
iteration: 9, abs(z): 0.588735685816267
iteration: 10, abs(z): 1.0730524976637672
iteration: 11, abs(z): 0.793560584649992
iteration: 12, abs(z): 1.4456959535695484
iteration: 13, abs(z): 1.386852094167046
iteration: 14, abs(z): 2.1324535049646074
iteration: 14; (-0.8+0.2j) is not in the Mandelbrot set
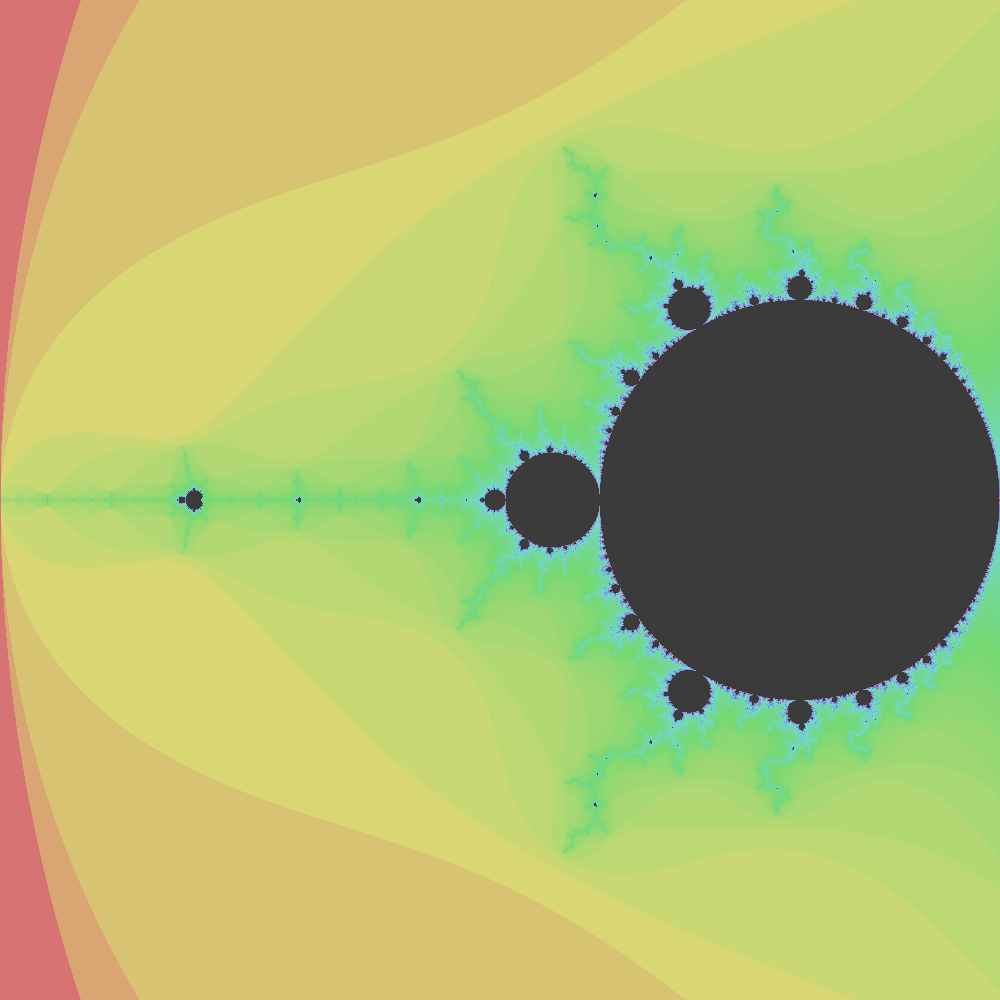
How is the Mandelbrot set used to generate fractal images? #
Instead of sampling numbers randomly as I’ve been doing, the numbers used to generate Mandelbrot fractal images are taken from the complex plane, close to the plane’s origin ().
The complex plane in the image below covers the range on both its real and imaginary axis. The Mandelbrot set exists in the range on the real axis, and somewhere in the range on the imaginary axis (to be confirmed later).
Mandelbrot fractals are generated by populating a plane with complex numbers in the appropriate range and then keeping track of the number of iterations it takes each number on the plane to show that it’s going to diverge to infinity. In practice this seems to mean, the number of iterations it takes for the magnitude of to exceed the threshold of .
The iteration counts are recorded in a 2D object (for example an array or a Python list). Numbers (points on the plane) that don’t meet the threshold of 2 within some number of iterations (for example, 50 iterations) are assigned a value of 0 in the iteration counts array.
Iteration counts are then arbitrarily associated with colors. For example, 0 (numbers in the Mandelbrot set) are commonly set to black. 5 iterations could be set to red, 10 iterations set to green… In pratice the color assignment is probably done programatically.
The iterations array is then mapped to pixels on the screen. For example iterations[0][0] will be
the top right corner of the screen. If iterations[0][0] = 15, and 15 iterations is associated with
the color red, the pixel at [0][0] will be colored red.
It’s easier to demonstrate this than explain it.
A basic Processing implementation #
This started by looking at the (Matplotlib) “Code #3” example at https://www.geeksforgeeks.org/python/mandelbrot-fractal-set-visualization-in-python/ .
It’s been revised a few times, with more revisions to come. Today I realized that I’d been rendering the imaginary plane upside down!
linspace is a simplification of the NumPy linspace method. It creates an even number of
divisions between a start point and an end point. Importantly (for fixing the upside down imaginary range
issue), the start point can be greater than the end point:
float[] linspace(float start, float end, int num) {
  float[] result = new float[num];
  if (num == 1) {
    result[0] = start;
    return result;
  }
  float step = (end - start) / (num - 1);
  for (int i = 0; i < num; i++) {
    result[i] = start + i * step;
  }
  return result;
}
The Complex class has methods for add, mult, magnitude.
class Complex {
  float re, im;

  Complex(float re, float im) {
    this.re = re;
    this.im = im;
  }

  Complex add(Complex other) {
    return new Complex(re + other.re, im + other.im);
  }

  Complex mult(Complex other) {
    return new Complex(
      re * other.re - im * other.im,
      re * other.im + im * other.re
      );
  }

  float magnitude() {
    return sqrt(re*re + im*im);
  }
}
Most of the actual computation happens in the setup function:
void setup() {
  size(1000, 1000); // cols, rows
  colorMode(HSB, 360, 100, 100);
  iterations = fillArray(imaginaryComponents, realComponents);
}
mandelbrot.pde (WIP):
int rows = 1000;
int cols = 1000;

int maxIters = 2000; // adjust, especially for zoomed in areas
int maxIterColorCutoff = 80;

int[][] iterations = new int[rows][cols];
// note that the imaginaryComponents range is from high to low;
// this means that in the array that stores the iteration counts, position[0][0] represents both
// the top right corner of the Processing window and the index of the smallest real component and
// _largest_ imaginary component:
float[] imaginaryComponents = linspace(1.25, -1.25, rows);
float[] realComponents = linspace(-2.0, 0.5, cols);

void setup() {
  size(1000, 1000); // cols, rows
  colorMode(HSB, 360, 100, 100);
  iterations = fillArray(imaginaryComponents, realComponents);
}

void draw() {
  for (int i = 0; i < iterations.length; i++) {  // i indexes the imaginary axis
    for (int j = 0; j < iterations[i].length; j++) {  // j indexes the real axis
      if (iterations[i][j] == 0) {
        // 0 means "(probably) in the Mandelbrot set";
        // these points iterated maxIters times without diverging
        stroke(0, 0, 0);
      } else { // not in set
        // float hue = map(iterations[i][j], 1, maxIterColorCutoff, 167, 360);
        // better approach for setting hue; compresses high values and spreads out low values:
        float hue = map(log(iterations[i][j]), log(1), log(maxIterColorCutoff), 167, 360);
        stroke(hue, 100, 100);
      }
      point(j, i);  // having to flip i and j here messes with my head
    }
  }
  // optionally save an image
  // save("mandelbrot_imp_full.png");
  noLoop();
}

// the logic to determine if a point on the complex plane is in the Mandelbrot set
int[][] fillArray(float[] imagVals, float[] realVals) {
  int[][] result = new int[rows][cols];

  for (int i = 0; i < imagVals.length; i++) {
    for (int j = 0; j < realVals.length; j++) {
      Complex c = new Complex(realVals[j], imagVals[i]);
      Complex z = new Complex(0, 0);
      boolean diverged = false;
      for (int iter = 0; iter < maxIters; iter++) {
        if (z.magnitude() >= 2) {
          result[i][j] = iter;
          diverged = true;
          break;
        } else {
          z = z.mult(z).add(c);
        }
      }
      if (!diverged) {
        result[i][j] = 0;
      }
    }
  }

  return result;
}

float[] linspace(float start, float end, int num) {
  float[] result = new float[num];
  if (num == 1) {
    result[0] = start;
    return result;
  }
  float step = (end - start) / (num - 1);
  for (int i = 0; i < num; i++) {
    result[i] = start + i * step;
  }
  return result;
}


class Complex {
  float re, im;

  Complex(float re, float im) {
    this.re = re;
    this.im = im;
  }

  Complex add(Complex other) {
    return new Complex(re + other.re, im + other.im);
  }

  Complex mult(Complex other) {
    return new Complex(
      re * other.re - im * other.im,
      re * other.im + im * other.re
      );
  }

  float magnitude() {
    return sqrt(re*re + im*im);
  }
}
Images #

start (imaginary): 0.625
end: (imaginary): -0.625
start (real): -2.0
end: (real): -0.75
start (imaginary): 0.10625
end: (imaginary): 0.09375
start (real): -0.75375
end: (real): -0.74125

start (imaginary): 0.103125
end: (imaginary): 0.096875004
start (real): -0.750625
end: (real): -0.744375

start (imaginary): 0.1015625
end: (imaginary): 0.0984375
start (real): -0.7490625
end: (real): -0.7459375

start (imaginary): 0.10075
end: (imaginary): 0.09925
start (real): -0.74825
end: (real): -0.74675

start (imaginary): 0.090040006
end: (imaginary): 0.08998
start (real): -0.74762696
end: (real): -0.747567

Floating point precision issues for tiny ranges #
When the difference between the imaginary and real start and end positions is tiny, images start to become pixilated. The problem is caused by floating point spacing, mostly here:
float[] linspace(float start, float end, int num) {
  float[] result = new float[num];
  if (num == 1) {
    result[0] = start;
    return result;
  }
  float step = (end - start) / (num - 1);
  for (int i = 0; i < num; i++) {
    result[i] = start + i * step;
  }
  return result;
}
I need to learn more about this, but….Floats don’t have uniform precision. The gap between numbers that can be represented consecutively grows with the magnitude (size) of the number. At around -1.79 (the range I’ve been testing in) consecutive floats are spaced apart. I’ve been trying step sizes in the range . This results in the same value repeating for 38 steps or so:
In [4]: 1.2e-7 / 3.2e-9
Out[4]: 37.49999999999999
I’ll deal with this in notes / Processing Mandelbrot improvements.
References #
Geeks For Geeks. “Mandelbrot Fractal Set visualization in Python.” Last Updated: September 4, 2023. https://www.geeksforgeeks.org/python/mandelbrot-fractal-set-visualization-in-python/ .
Wikipedia contributors. “Mandelbrot set.” Accessed on: January 21, 2026. https://en.wikipedia.org/wiki/Mandelbrot_set .
-
Wikipedia contributors, “Mandelbrot set,” Accessed on: January 21, 2026, https://en.wikipedia.org/wiki/Mandelbrot_set . ↩︎